How to use it
- Open Settings → Agent usage, then select the available Agent and time range.
- Review the reported tokens, cache, and attributable cost together with the run records.
- If a value is missing, inspect the source Agent or the run before drawing a comparison.
Agent usage view
The page filters reported usage by time range, Agent, provider, model and cost grouping. Missing source data remains unknown.
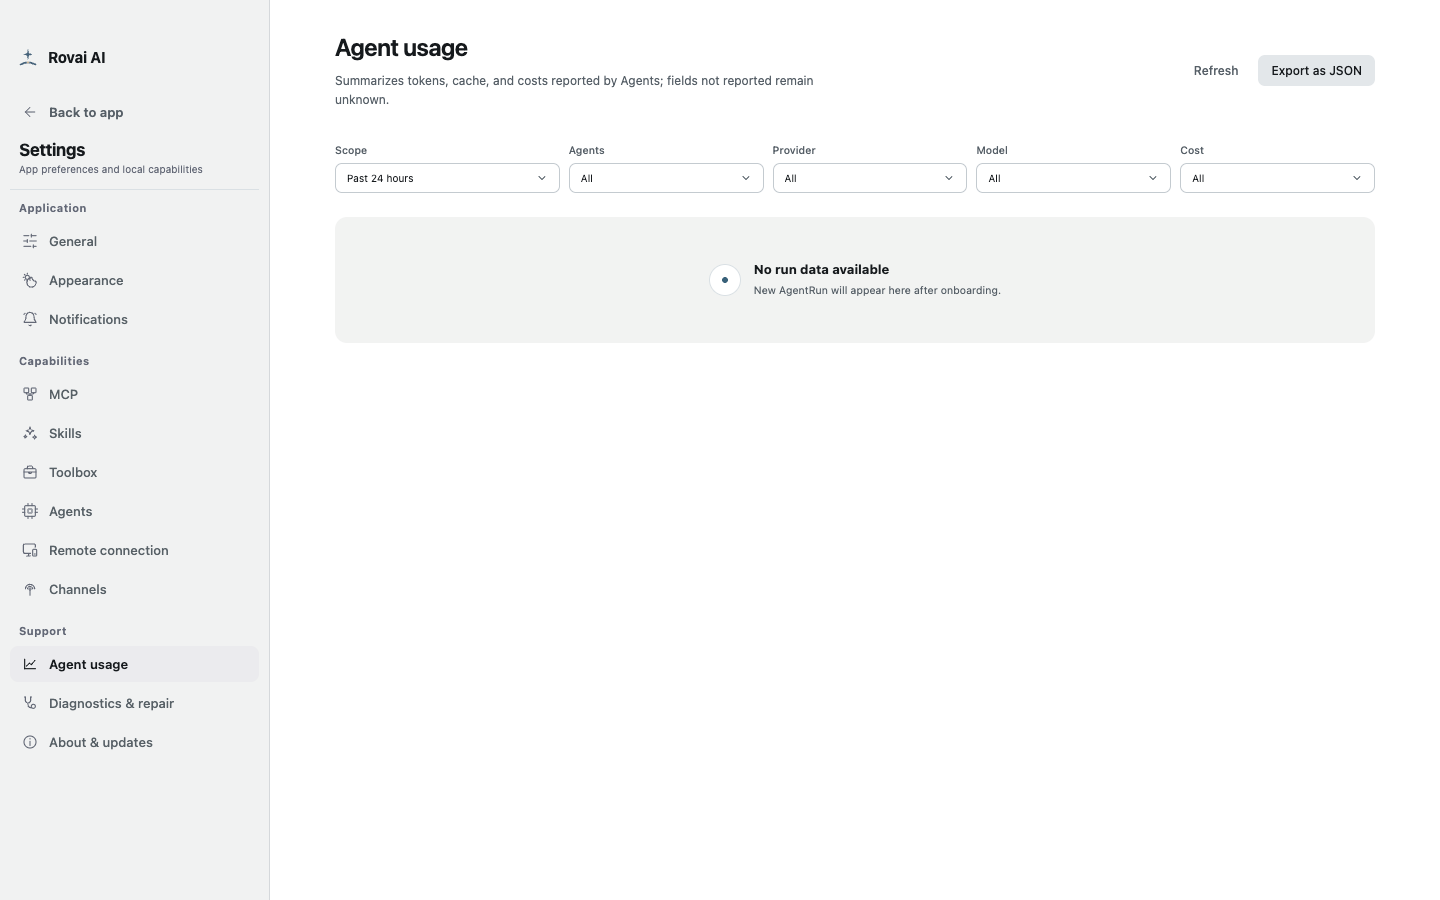
Filters and measures
- Time range
- Switch among the past 24 hours, 7 days and 30 days to compare similar periods.
- Agent / provider / model
- Narrow the table to the source you want to investigate. Model names and availability depend on the source Agent.
- Tokens and cache
- These numbers come from what the Agent reports for a run. A source that omits a field does not imply zero use.
- Cost grouping
- View by model call, turn, run or session when the source provides enough attribution.
- Export
- Use JSON export when you need to inspect or compare the reported raw entries outside the App.
Read the number with its coverage
A missing value is unknown, not zero. A cost estimate shown in Rovai may differ from the provider’s final bill or account usage page.
When a run appears absent, check its time range and Agent filter, then compare with the execution record. Use Refresh for newly completed work.